Cengage (2021) Digital Learning Pulse Survey: Pandemic Era Report Card Independence KY: Cengage, April 27
Note: this is in the form of an Infographic: it is NOT a full research report.
What is the study about?
The Digital Learning Pulse Survey is an ongoing four-part series to better understand the needs of colleges in the wake of the transformative disruption brought on by COVID-19. The surveys are conducted by Bay View Analytics on behalf of the Online Learning Consortium (OLC), WICHE Cooperative for Educational Technologies (WCET), University Professional and Continuing Education Association (UPCEA), Canadian Digital Learning Research Association (CDLRA ) and primary partner and underwriter Cengage. This project is devoted to discovering the true picture of this major shift to digital, taking a pulse on how faculty and administrators are feeling during this life-changing time.
The fourth one in the series, this survey includes student as well as faculty and administrator responses, covering the period Fall 2020 to Spring 2021 inclusive. (Declaration of interest: I am Chair of the Board of CDLRA, but was not involved in this study.)
Methodology
1,286 faculty and administrators and 1,469 students across 856 U.S. post-secondary institutions were surveyed between March 30 and April 12, 2021.
Main results
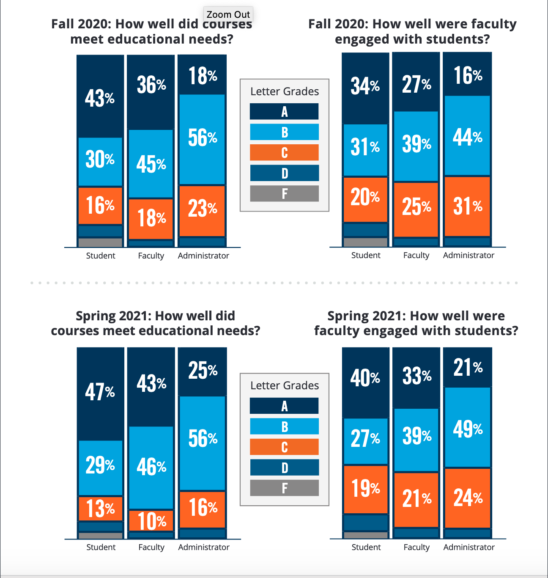
As can be seen from the graphic, responses from all three groups tend to be surprisingly positive, in terms of the ‘grades’ given to their educational experience during the pandemic:
Fall 2020 How well did courses meet educational needs?
- 73% of students gave their courses A (43%) or B grades (30%); only 11% gave a D or F
- 81% of faculty gave their courses A (36%) or B grades (45%); only 1% gave a D or F
- 74% of administrators gave their courses A (18%) or B grades (56%); only 3% gave a D or F
Spring 2021 How well did courses meet educational needs?
- 76% of students gave their courses A (47%) or B grades (29%); only 11% gave a D or F
- 89% of faculty gave their courses A (43%) or B grades (46%); only 3% gave a D or F
- 74% of administrators gave their courses A (18%) or B grades (56%); only 1% gave a D or F
Fall 2020 How well were faculty engaged with students?
- 65% of students rated faculty engagement A (34%) or B grades (31%); only 15% gave a D or F
- 66% of faculty rated faculty engagement A (27%) or B grades (39%); only 7% gave a D or F
- 60% of administrators rated faculty engagement A (16%) or B grades (44%); only 9% gave a D or F
Spring 2021 How well were faculty engaged with students?
- 67% of students rated faculty engagement A (40%) or B grades (27%); only 14% gave a D or F
- 72% of faculty rated faculty engagement A (33%) or B grades (39%); only 9% gave a D or F
- 70% of administrators rated faculty engagement A (21%) or B grades (49%); only 6% gave a D or F
It can be seen that there was a slight increase in satisfaction between the fall and spring semesters for all groups.
Most pressing student challenges: stress
All three groups (students, faculty and administrators) reported that stress was the most pressing challenge, followed by maintaining motivation and then having coursework to do.
More optimism about online learning and use of digital materials
In response to the question: ‘In what ways have your attitudes about your academic program changed since prior to the pandemic?’:
- 57% of students replied they were more optimistic about online learning
- 52% of students replied they were more optimistic about use of digital materials
- 48% of students replied they were more optimistic about courses that combine in-person and online instruction
- 47% of students replied they were more optimistic about online proctoring (with 17% more pessimistic)
Student preferences for post-pandemic study
In terms of what kind of courses that would like to take post-pandemic, students responded as follows:
- Some courses fully online: 74% agree (46% strongly, 38% somewhat)
- Some courses as a combination of in-person and online instruction: 68% agree (35% strongly, 33% somewhat)
- More technology in in-person classes: 68% agree (38% strongly, 30% somewhat)
- More digital materials/digital resources: 68% agree (38% strongly, 30% somewhat)
The same question was also asked of faculty and administrators, with somewhat similar results.
My comments
This survey unearthed significant results, indicating that students, faculty and administrators were in general satisfied with the learning experience during the pandemic, which given the challenges of moving almost entirely to remote learning I find quite surprising and comforting. It also indicated that there were improvements between the fall and spring semesters, suggesting that all parties were still learning from the experience.
Again, though, I would add some caution. This is another quick and dirty survey. We do not know how valid or reliable the sampling is in these kinds of studies. They refer only to experience in the USA.
Nevertheless students, faculty and administrators should be congratulated overall for managing such a radical change so well, if these results are replicated in larger, more scientific studies, which I believe they will be.


 Dr. Tony Bates is the author of eleven books in the field of online learning and distance education. He has provided consulting services specializing in training in the planning and management of online learning and distance education, working with over 40 organizations in 25 countries. Tony is a Research Associate with Contact North | Contact Nord, Ontario’s Distance Education & Training Network.

